
1What it shows
Market Sessions puts a thin strip at the bottom of the chart. Every market gets a row, and under every candle there is a small square. If the square is in the market's color, that market was open when the candle formed. If it is grey, it was closed.
| Mark | Meaning |
|---|---|
| Open | Full color. |
| Closed | Dim grey. |
| Holiday | An empty frame in the market's color. The exchange is shut that day. |
| Pre / post | A dimmer shade of the market color: pre-market, after-hours, auction or lunch break. Only drawn if you switch it on, otherwise these count as closed. |
You enter the hours as the exchange keeps them, in its own local time, and the indicator works out the rest. Summer and winter time are handled per market, so the strip stays right when the US and Europe change their clocks on different weekends. Bank holidays come from the ForexFactory calendar.
The strip is part of the price panel, not a separate one. The price scale is stretched down a little to make room, so it never covers a candle.
A prop account leaves little room for surprises, and a lot of the surprises are about the clock: a session that has not opened yet, a market that is shut for a holiday, a cut-off you forgot to convert to your time zone. The strip shows the first two at a glance, and the daily close line (section 5) puts the cut-off of your firm on the chart.


2Installation
The indicator is free but needs a license key. Without one it draws nothing and only shows a short note with your machine ID.
| Step | What to do |
|---|---|
| 1 | Create an account on mofoli.com/market-sessions and confirm your e-mail address. |
| 2 | Press Get free license. The key appears. |
| 3 | In NinjaTrader go to Tools → Import → NinjaScript Add-On... and pick MofoliMarketSessions.zip. |
| 4 | Add the indicator to a chart (right-click → Indicators, folder MofoliFX) and paste the key into 0 License → License key. |
One key works on up to 3 PCs. After the first successful check the indicator also starts without an internet connection.
If you prefer to install by hand, copy the file to Documents\NinjaTrader 8\bin\Custom\Indicators\MofoliFX\MarketSessions.cs and press F5 in the NinjaScript Editor.
3Where to start
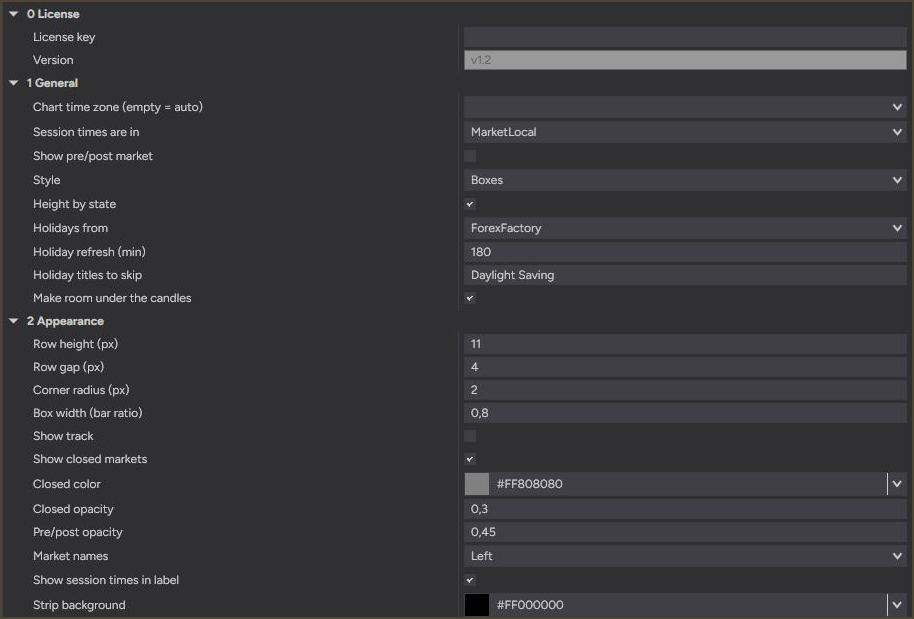
The defaults are usable as they are. In practice most people touch only a few things.
Show pre/post market is the one I would try first. With it on, the pre-market and after-hours periods show up in a dimmer color, which tells you a lot about when New York really starts to matter. Style switches between squares and continuous bars, and it is a matter of taste. Row height makes everything bigger, worth a look on a small screen or when you record the chart. Market names moves the labels to the right or hides them.
A tidy setup is the defaults. A fuller one has Show pre/post market and Show track switched on. A calmer one uses Style: Bands with Height by state on.
4Markets and time zones
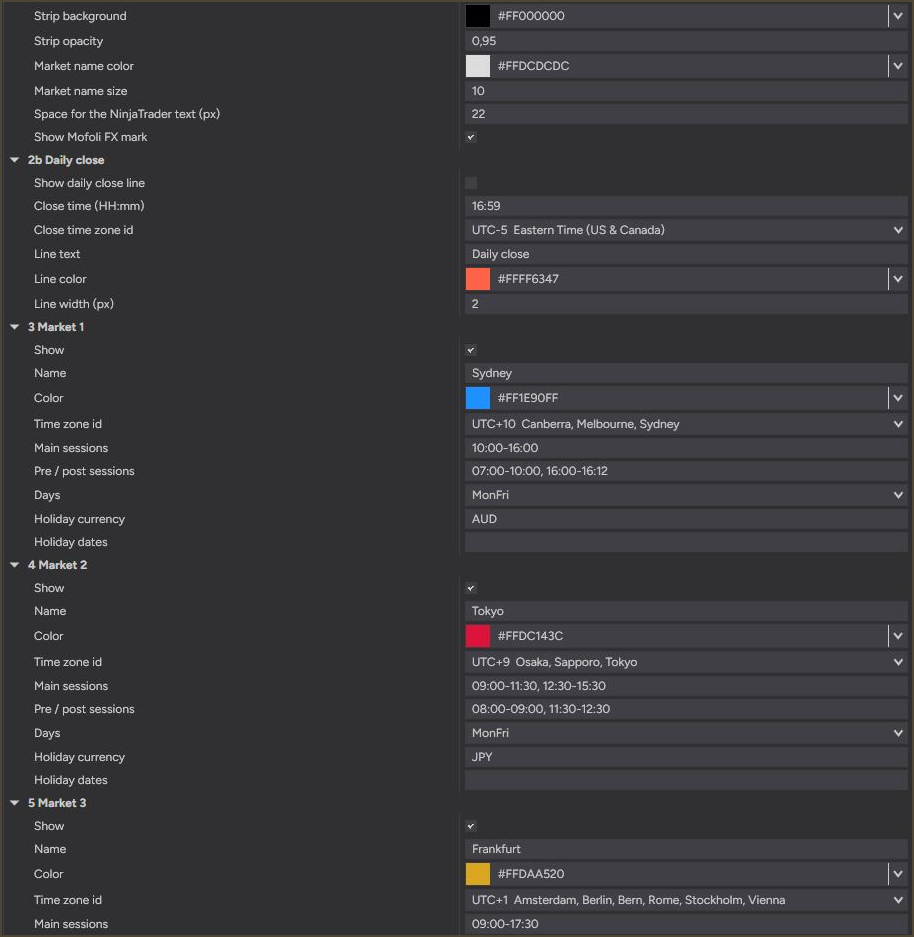
There are six market rows, each with its own name, color and hours. Enter the hours in the exchange's local time, and pick the exchange's time zone from the drop-down list of the same market. The list shows the UTC offset first and then the name, for example UTC+1 Amsterdam, Berlin, Bern, Rome. The indicator converts to your chart time and applies daylight saving on its own.
Hours are written as 09:00-17:30. Add a second range for a lunch break (09:00-11:30, 12:30-15:30). A range across midnight works too (22:00-02:00).
| Market | Time zone in the list | Main hours (local time) |
|---|---|---|
| Sydney | UTC+10 Canberra, Melbourne, Sydney | 10:00-16:00 |
| Tokyo | UTC+9 Osaka, Sapporo, Tokyo | 09:00-11:30, 12:30-15:30 |
| Frankfurt | UTC+1 Amsterdam, Berlin, Bern, Rome... | 09:00-17:30 |
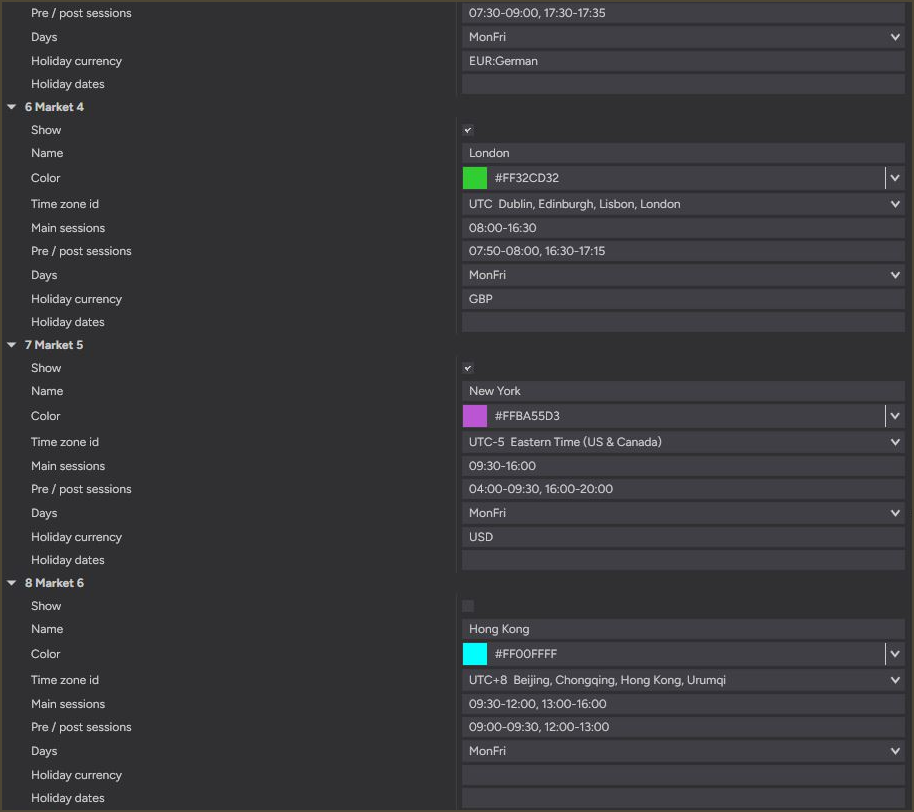
| London | UTC Dublin, Edinburgh, Lisbon, London | 08:00-16:30 |
| New York | UTC-5 Eastern Time (US & Canada) | 09:30-16:00 |
| Hong Kong (off by default) | UTC+8 Beijing, Chongqing, Hong Kong... | 09:30-12:00, 13:00-16:00 |
Bank holidays
On a bank holiday the market is treated as closed for the whole day and the squares turn into empty frames. The dates come from the ForexFactory calendar, which the indicator downloads and stores itself. The calendar does not cover Hong Kong, so if you use that row, type its holidays into Holiday dates (for example 2026-12-25).
5Daily close line
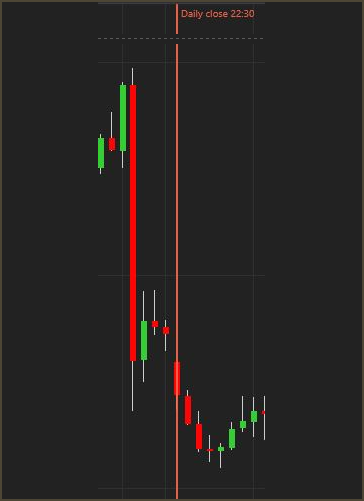
Many firms want every position flat before a daily cut-off, and a position left open past it can cost you the account. The daily close line marks that time on the chart on every day, in the time zone of your firm, so there is nothing to convert in your head at the end of a long session.
Switch on Show daily close line in the 2b Daily close group, enter the time of your firm in Close time and pick its time zone. The default is 16:59 Eastern Time (US & Canada), which follows daylight saving. Line text, color and width are optional.
The default is only an example. Cut-off times differ from firm to firm and sometimes from account type to account type, so read your own rules and enter that time.
What it gives you on a funded account
| Situation | What the indicator does |
|---|---|
| The daily cut-off of your firm | A vertical line at that time on every day, with daylight saving taken care of. |
| Trading around the London and New York open | The market squares change color when the session opens and closes, in your chart time. |
| Bank holidays | An empty frame on the days a market is shut, so a thin session does not catch you out. |
| More than one firm or account | The cut-off time and time zone are yours to set, so each setup can use its own. |
6All settings
The groups are the same as in the indicator window. Group 0 License also holds the read-only Version.
General
| Setting | Default | What it does |
|---|---|---|
| Session times are in | MarketLocal | Leave it as is. The hours you enter are the exchange's own local hours, so nothing needs changing when the clocks change. ChartTime is there for those who prefer to type hours in chart time, but then the US and Australian clock changes have to be corrected by hand. |
| Show pre/post market | Off | On: pre-market, after-hours, auctions and lunch breaks show up in a dimmer color. Off: they count as closed. |
| Style | Boxes | Boxes is one square per candle. Bands joins neighbouring candles with the same state into one continuous bar. |
| Height by state | On | Bands only. Closed is a thin line, pre/post a medium bar, open the full height. |
| Holidays from | ForexFactory | Source of the bank holidays. ForexFactory is the automatic calendar, Manual uses only the dates you type in, Off switches holidays off. |
| Make room under the candles | On | Stretches the price scale downward by the height of the strip, so the lowest candle never runs into it. |
| Chart time zone | empty | Leave it empty and the indicator uses the time zone of your chart. Set it only if the chart clock runs in a different one. |
| Holiday refresh (min) | 180 | How old the downloaded calendar may get before it is fetched again (15 to 1440). The download runs in the background. |
| Holiday titles to skip | Daylight Saving | Calendar entries containing these words are ignored. ForexFactory lists the clock change as a holiday, which it is not. |
Appearance
| Setting | Default | What it does |
|---|---|---|
| Row height (px) | 11 | Height of a market row, and the size of the squares in Boxes style (4 to 80). |
| Row gap (px) | 4 | Space between the rows. |
| Corner radius (px) | 2 | Rounding of the squares and bars. 0 is square. |
| Box width (bar ratio) | 0.8 | Width of a square against the candle spacing. At 1.0 the squares touch. |
| Show closed markets | On | Draws the dim grey mark while a market is closed. |
| Show track | Off | A faint lane behind each row, so the closed parts have something to sit on. |
| Closed color / opacity | Gray / 0.3 | Color and transparency of the closed mark. |
| Pre/post opacity | 0.45 | Transparency of the pre/post mark. Lower is dimmer. |
| Market names | Left | Left, Right or Off. |
| Show session times in label | On | Adds the hours in chart time next to the name (London 09:00-17:30). Handy for checking against the time axis. |
| Strip background / opacity | Black / 0.95 | Background of the strip. Below 1.0 the candles show through a little. |
| Market name color / size | Gainsboro / 10 | Color and font size of the names. |
| Space for the NinjaTrader text (px) | 22 | NinjaTrader prints its own text in the bottom left corner. The rows stay this far above the edge so they do not run into it. |
| Show Mofoli FX mark | On | A small MOFOLI FX mark in the bottom right corner of the strip. |
2b Daily close
| Setting | Default | What it does |
|---|---|---|
| Show daily close line | Off | Draws a vertical line at the cut-off time on every day of the chart. |
| Close time (HH:mm) | 16:59 | The cut-off time, in the time zone below. |
| Close time zone | Eastern Time (US & Canada) | Pick it from the list. It follows daylight saving. Empty means the chart clock. |
| Line text | Daily close | Text next to the line, with the time added. Empty for no text. |
| Line color | Tomato | Color of the line. |
| Line width (px) | 2 | 1 to 6. |
Markets (Market 1 to 6)
| Setting | Default | What it does |
|---|---|---|
| Show | on (Market 6 off) | Switches the row on or off. The sixth market, Hong Kong, is off by default. |
| Name | Sydney, Tokyo, Frankfurt, London, New York, Hong Kong | Rename it to whatever you like. |
| Color | The color of the market on the strip. | |
| Time zone | The exchange's time zone, from the drop-down list. | |
| Main sessions | Regular trading hours in the exchange's local time, e.g. 09:30-16:00. Several ranges are separated by commas. | |
| Pre / post sessions | Pre-market, after-hours and auctions, same format. Drawn only when Show pre/post market is on. | |
| Days | MonFri | MonFri, SunFri, MonSat or AllDays. |
| Holiday currency | The currency whose bank holidays close this market, e.g. USD. A keyword can follow after a colon (EUR:German) to narrow it down. | |
| Holiday dates | Your own closed days: 2026-12-25 for one day, 12-25 for every year, separated by commas. |
7When something looks wrong
| Problem | What to check |
|---|---|
| Nothing is drawn. | Almost always the license key. Paste it into 0 License → License key. The note on the chart shows your machine ID. |
| The strip does not line up with the time axis. | Switch on Show session times in label and compare. Then check the time zone of that market. |
| A holiday is missing. | Look at Holidays from and Holiday currency. If the calendar does not list the day, type it into Holiday dates. |
| Names run into the squares. | Lower Market name size, or raise Row height and Row gap. |
| No daily close line. | It is off by default. Switch it on in group 2b and check the time and the time zone. |
Still stuck? Write to us from your account, in the Support section, or see the FAQ.